
ES Review & Prep
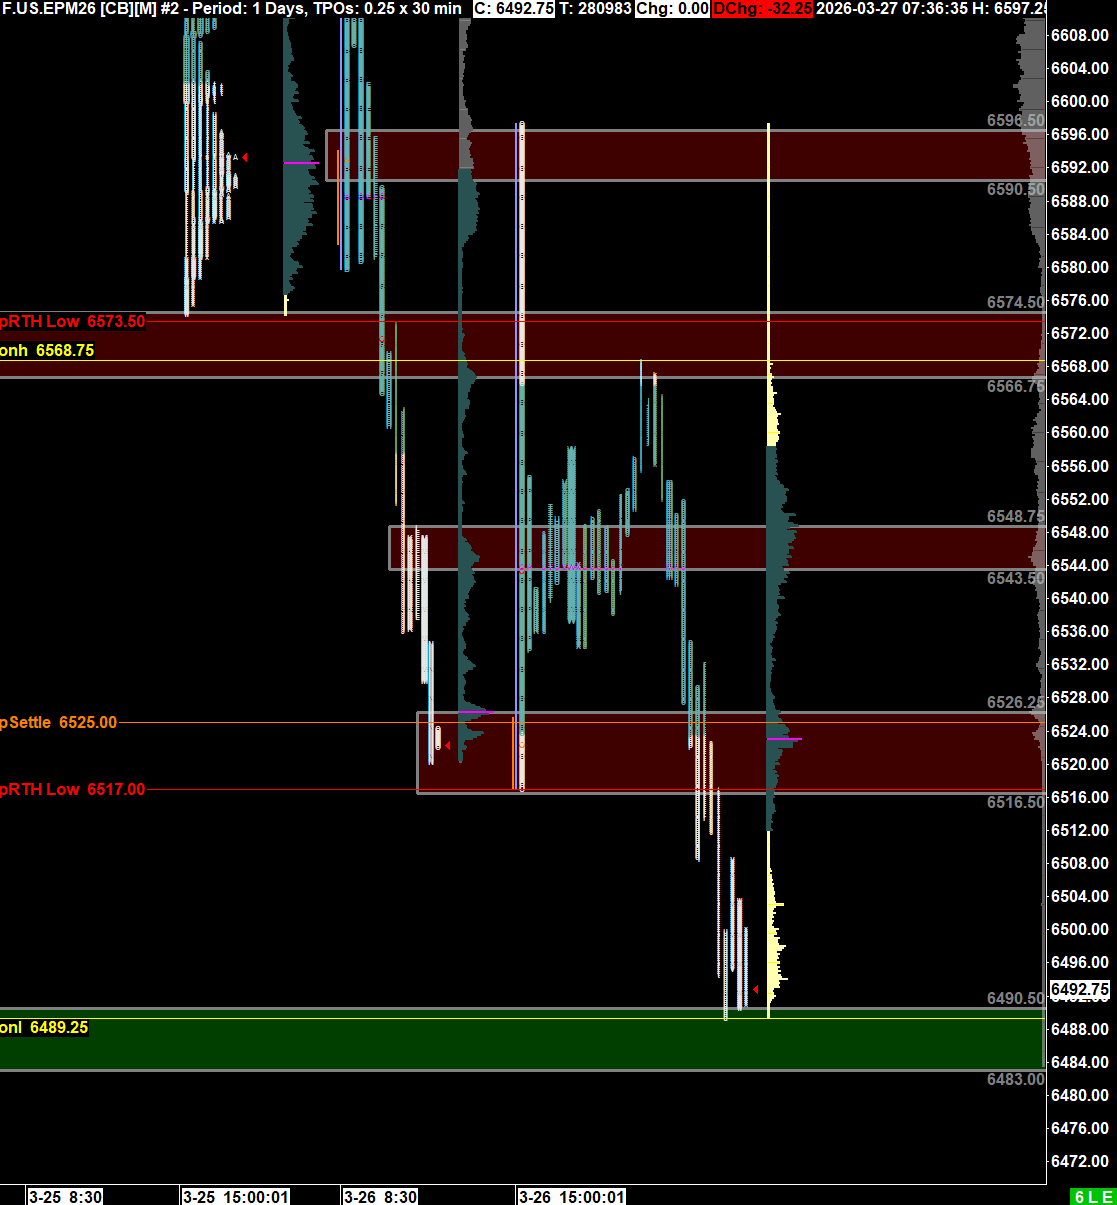
Yesterday opened with a gap below the prior RTH range, and the rally attempt to close it failed in the initial resistance zone at 6616.25-22.75 and sold off to close in to the key 6518-24.50 RTH support zone.
Overnight saw a weak attempted rally in the Asian session, followed by a downtrend into the very key ETH support zone at 6483-90.50, which was the low and pullback low from Monday before the 250 point spike. Failure of this zone likely to accelerate the selloff with little in way of support below.
The dollar is bid, Vix is pushing 30, and the Treasury curve is bear steepening pre-market…not conducive to a risk-on day and in my view the reality of the war and its repercussions through the economy are finally hitting home. It has been an orderly downtrend over the past month so far, but that could change dramatically. Historically markets tend to crash from oversold levels (RSI on daily currently 26).
We may see an attempt to close the gap from yesterday after the open, but without materially positive news the most likely scenario looks lower. However, if there’s a reversal into yesterday’s range and value area then we could see fast covering of the overnight short positioning and looking to sell into resistance zones if the upside has weak momentum and volume.
Today’s zones below:
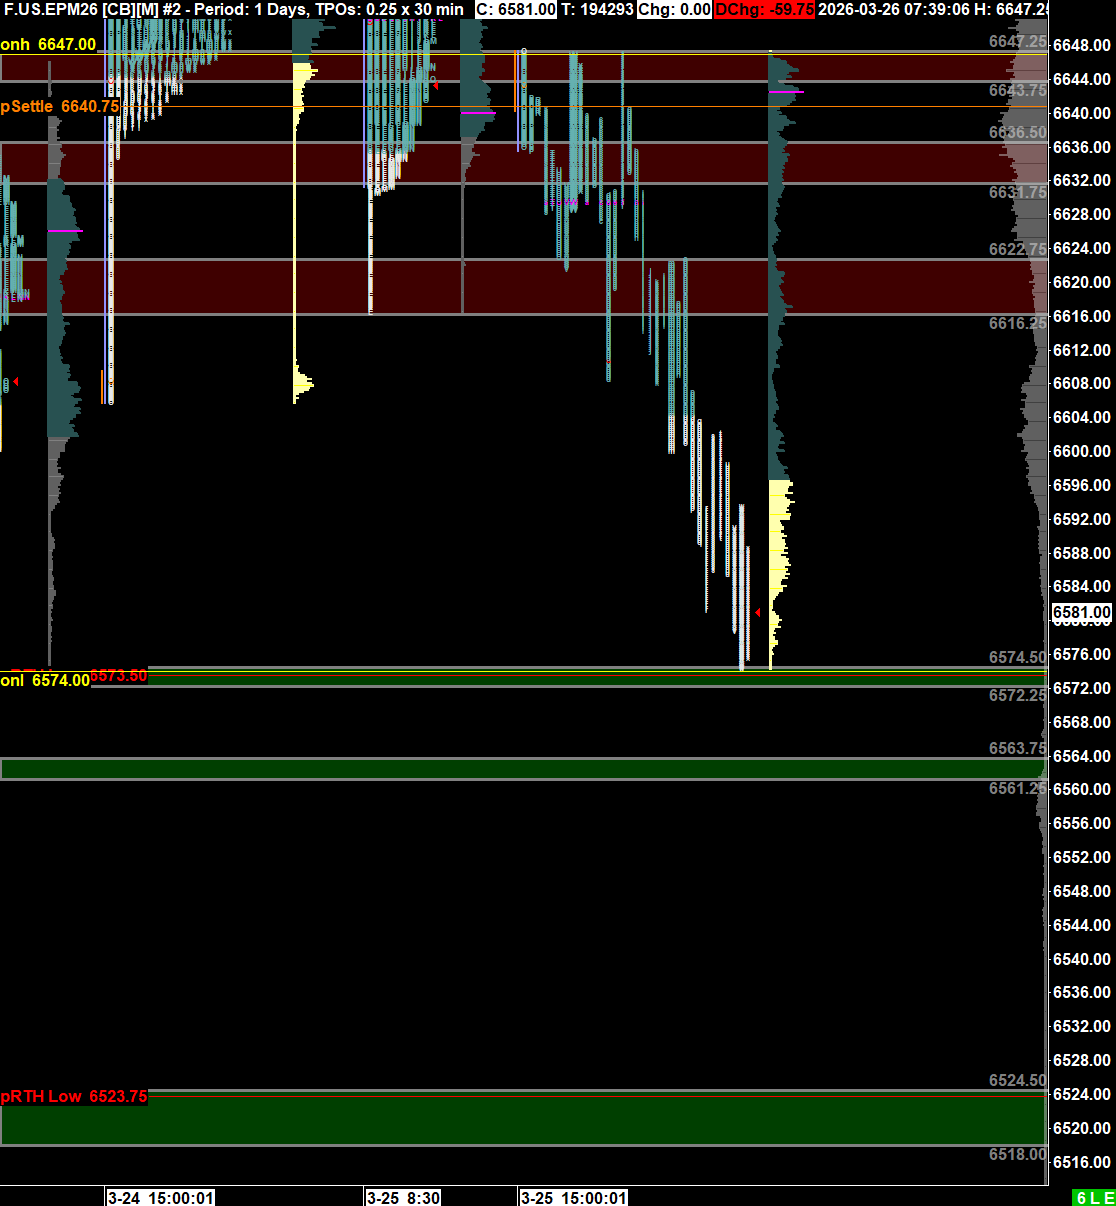
ES Review & Morning Prep
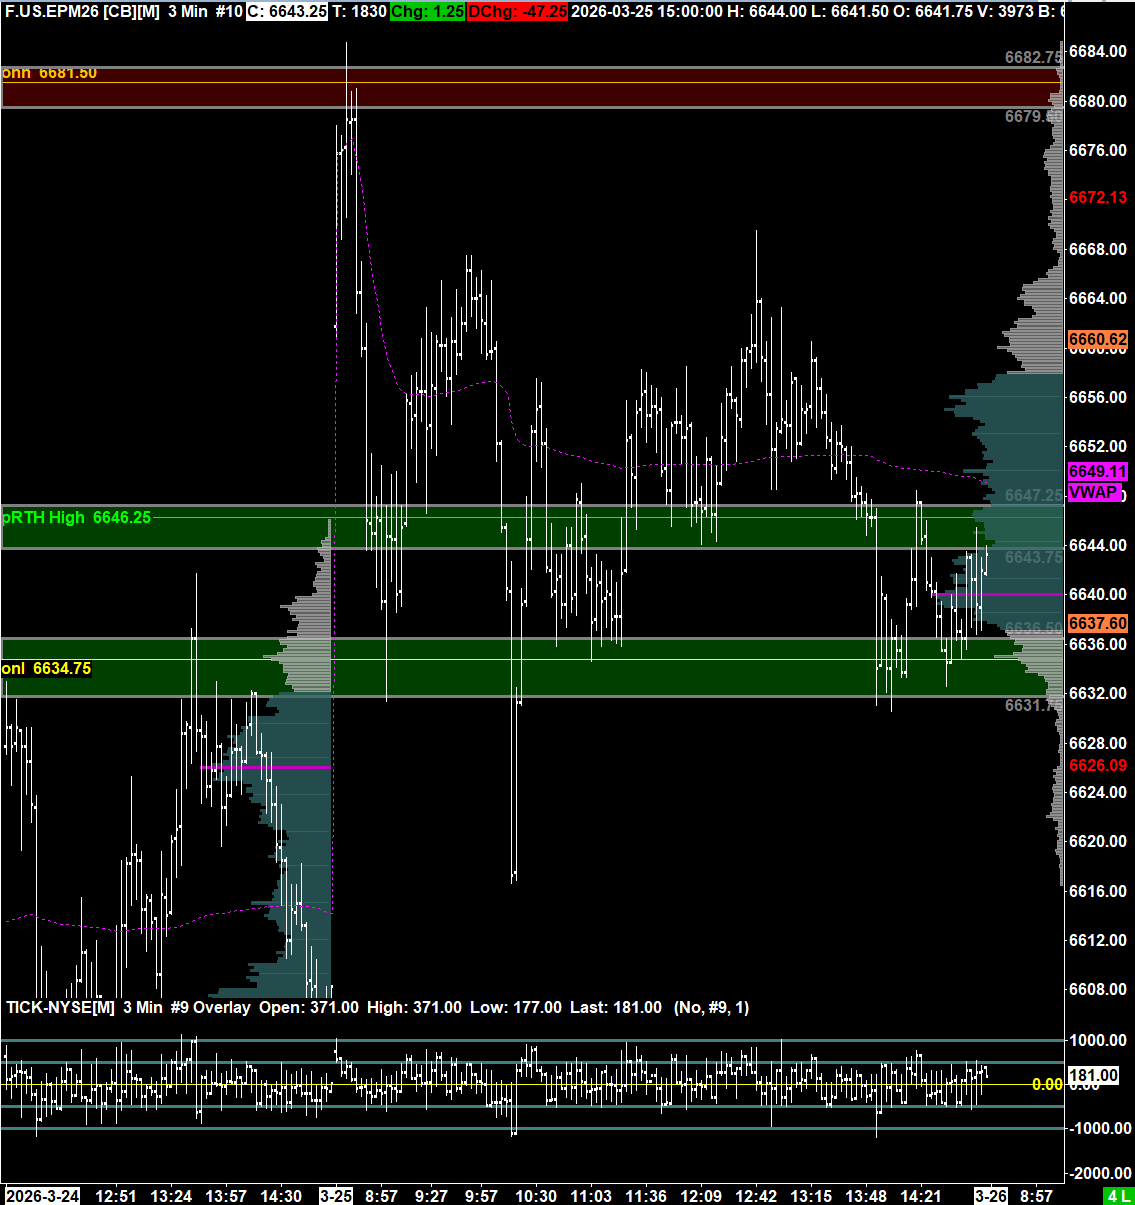
Yesterday’s RTH session offered an early fade opportunity at the overnight high, in line with the overall trend since the Iran war started. Intraday bias was neutral. The perfect trade would have been selling the overnight high and covering at the prior day value area high: 6681.50 to 6632.00, which happened in the first half hour. Great in hindsight, not so easy in real time in a jumpy headline driven market.
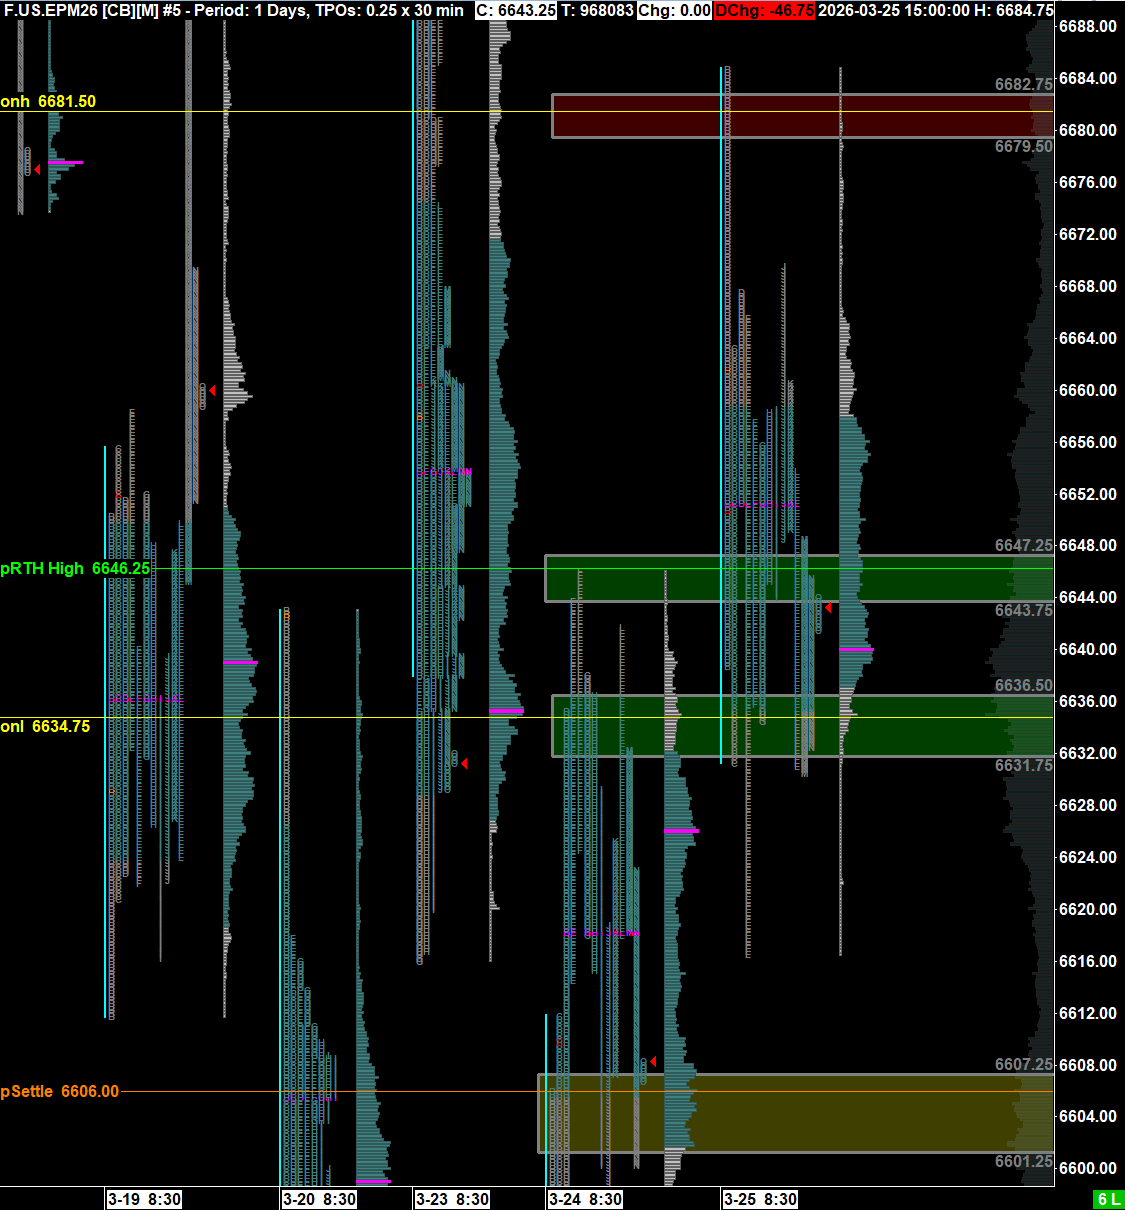
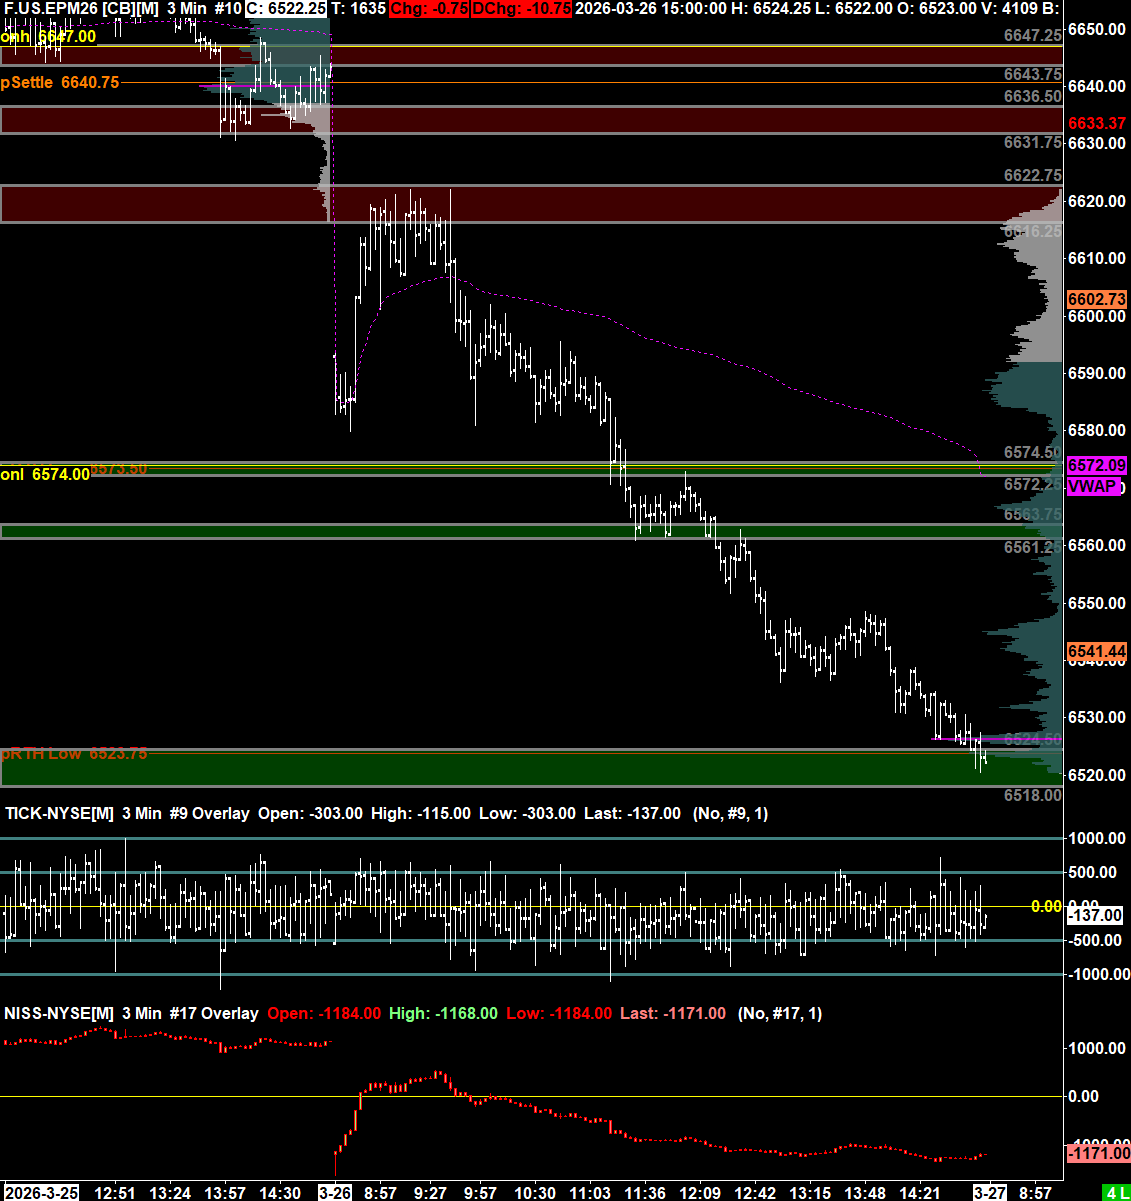
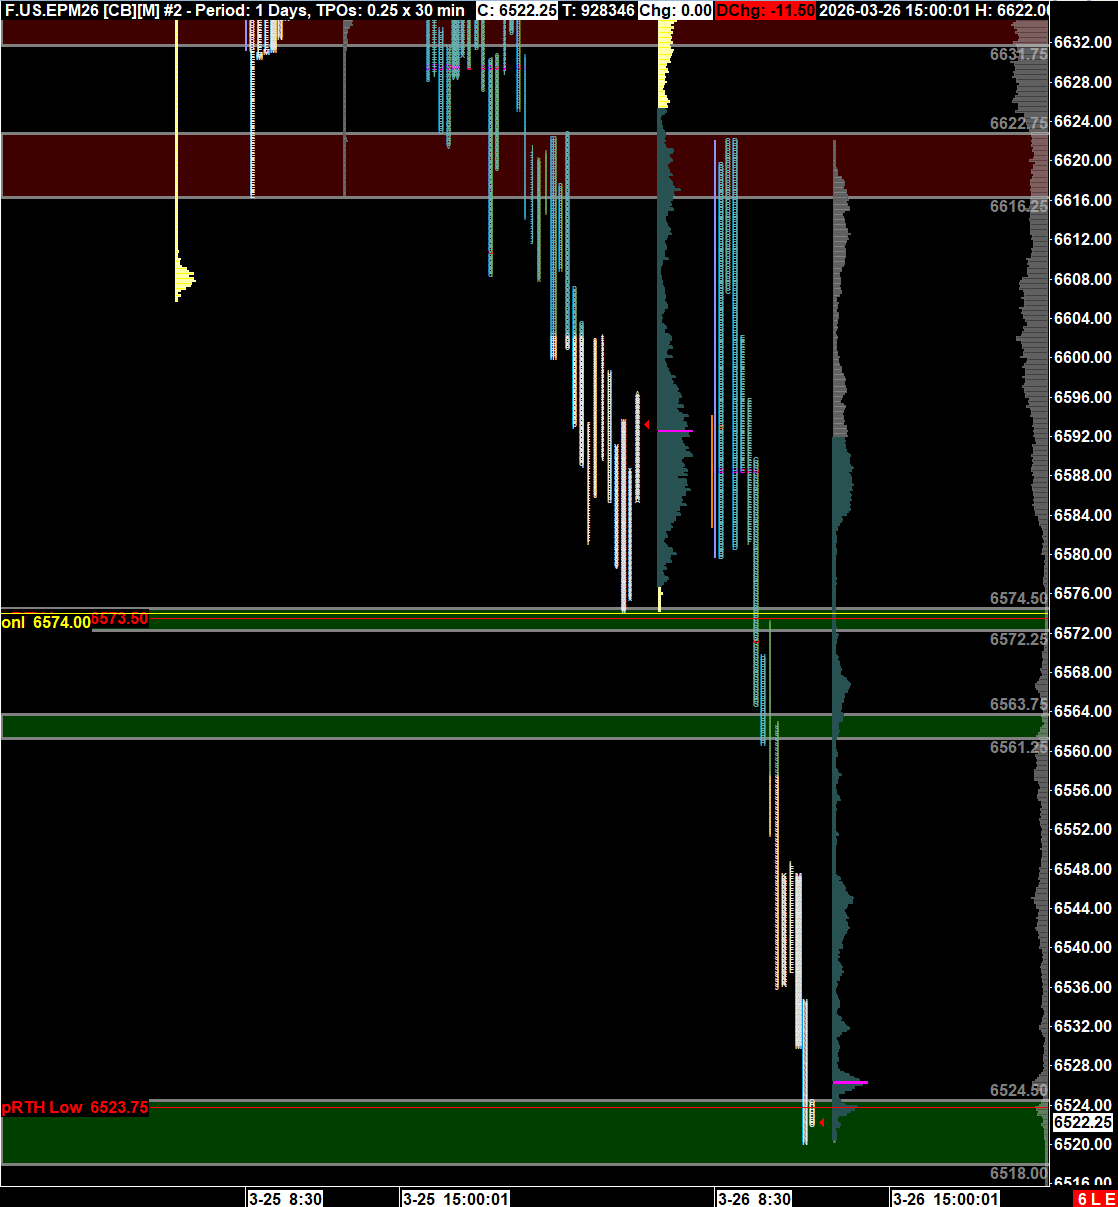
Overnight so far ES has retested the prior support zones from below, and failed. It has broken the short term bull/bear from yesterday and is currently holding beneath 6600 (settlement was 6640.75). The RTH low at 6573.50 was nearly touched. The range has been 6647.00-6574.00 so far in a slow down trend.
The zones for today are below. The key zone for longs need to hold is 6572-6574.50 which is the bottom of the few days balance since Trump’s 200 point rally tweet on Monday. I don’t expect it to hold but will wait for the market to show it’s hand, and failure to break down could lead to a sharp move higher into the upper zones where sellers are likely to step in again I expect.
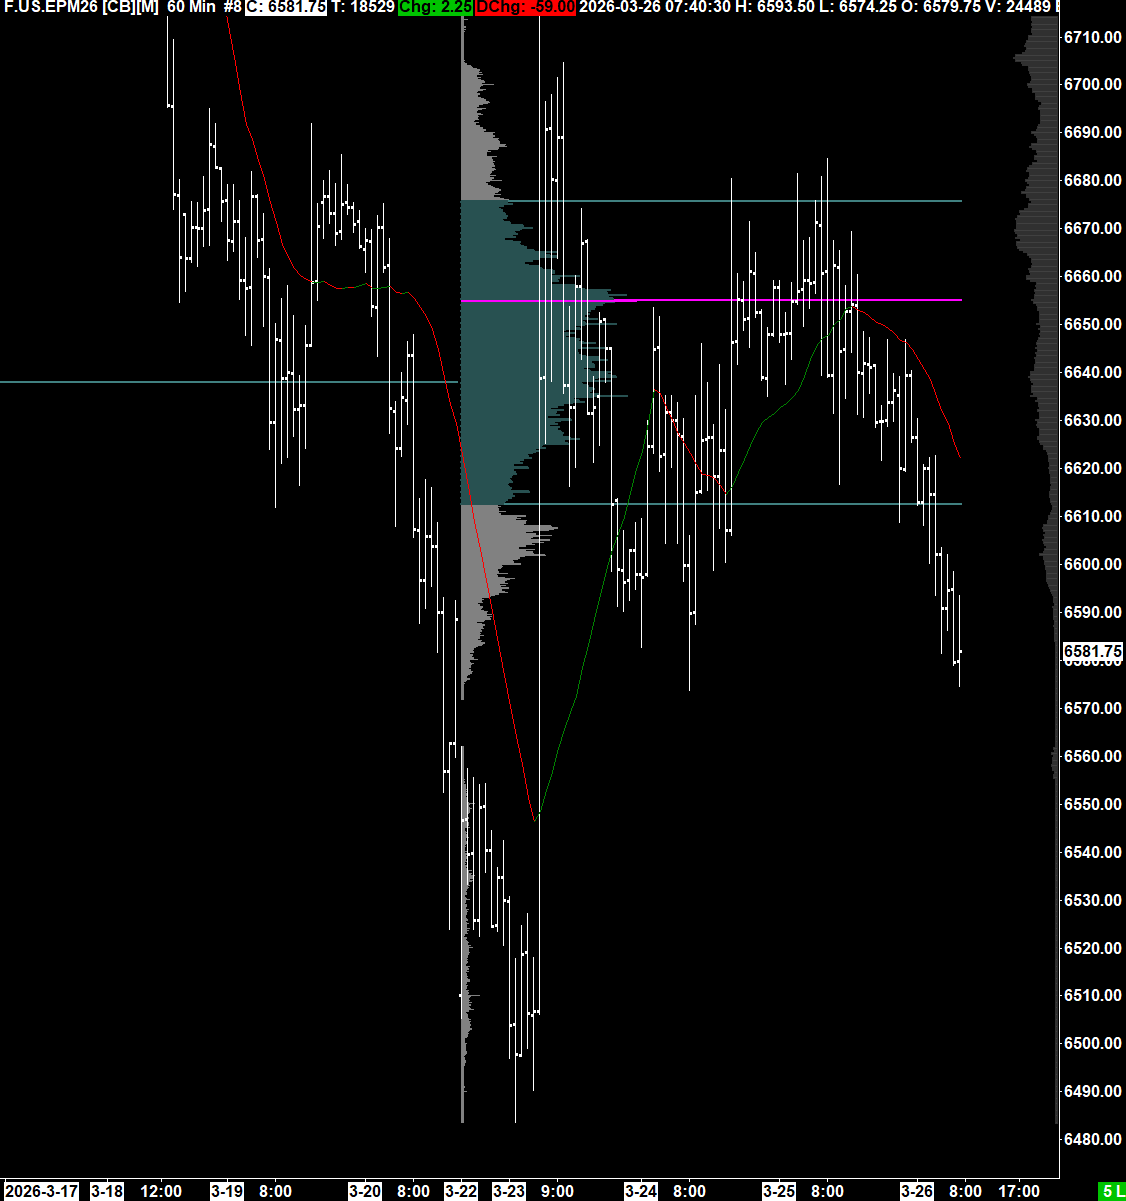
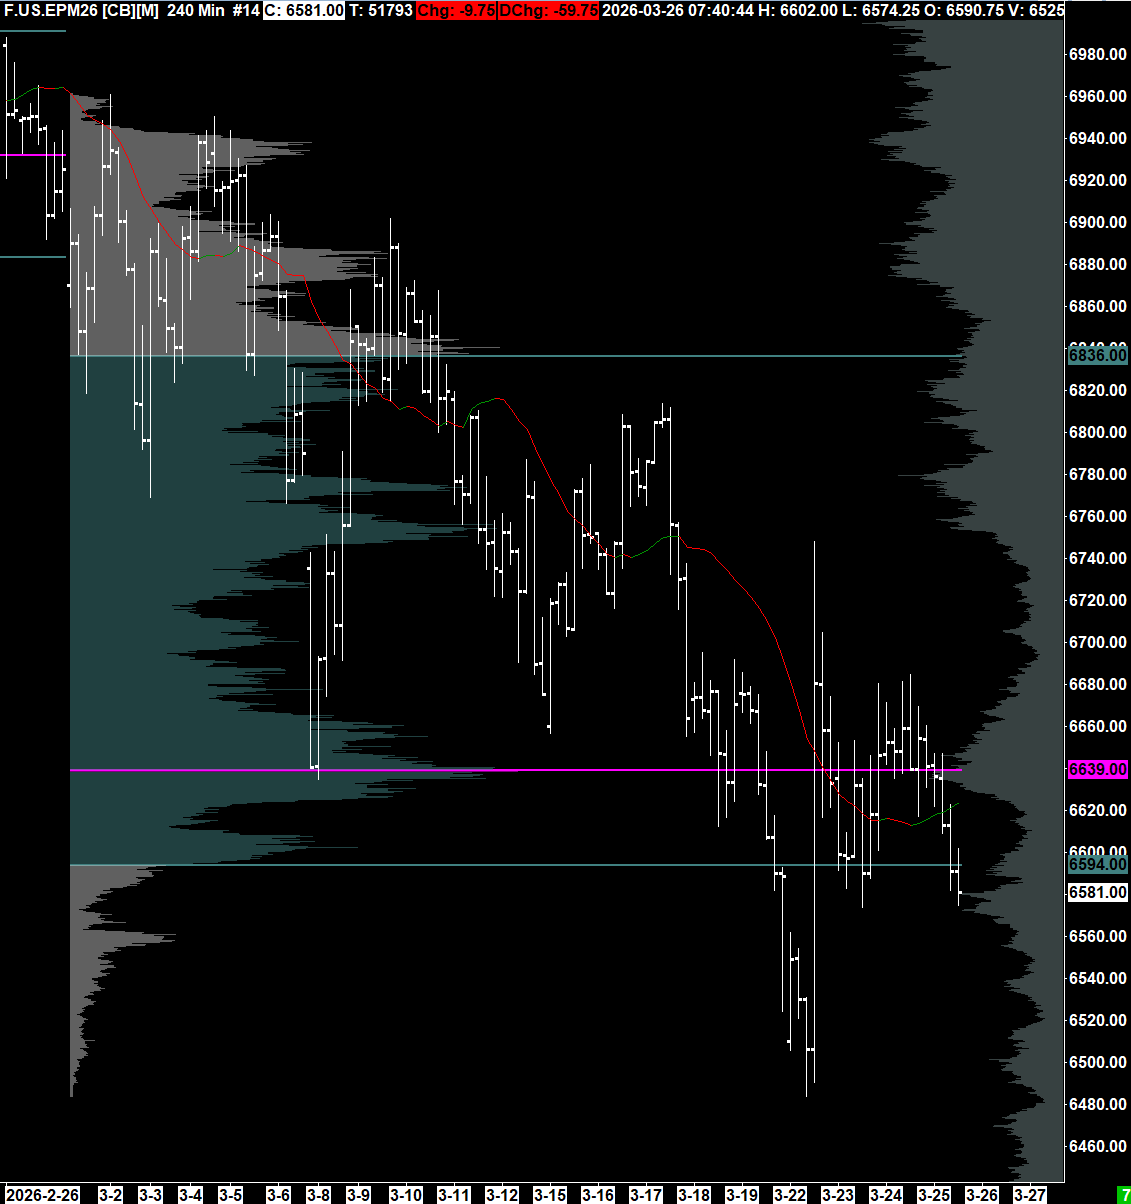
ES Morning Prep
Before looking at today’s zones of interest, let’s look at the bigger picture on the underlying cash market (SPX)
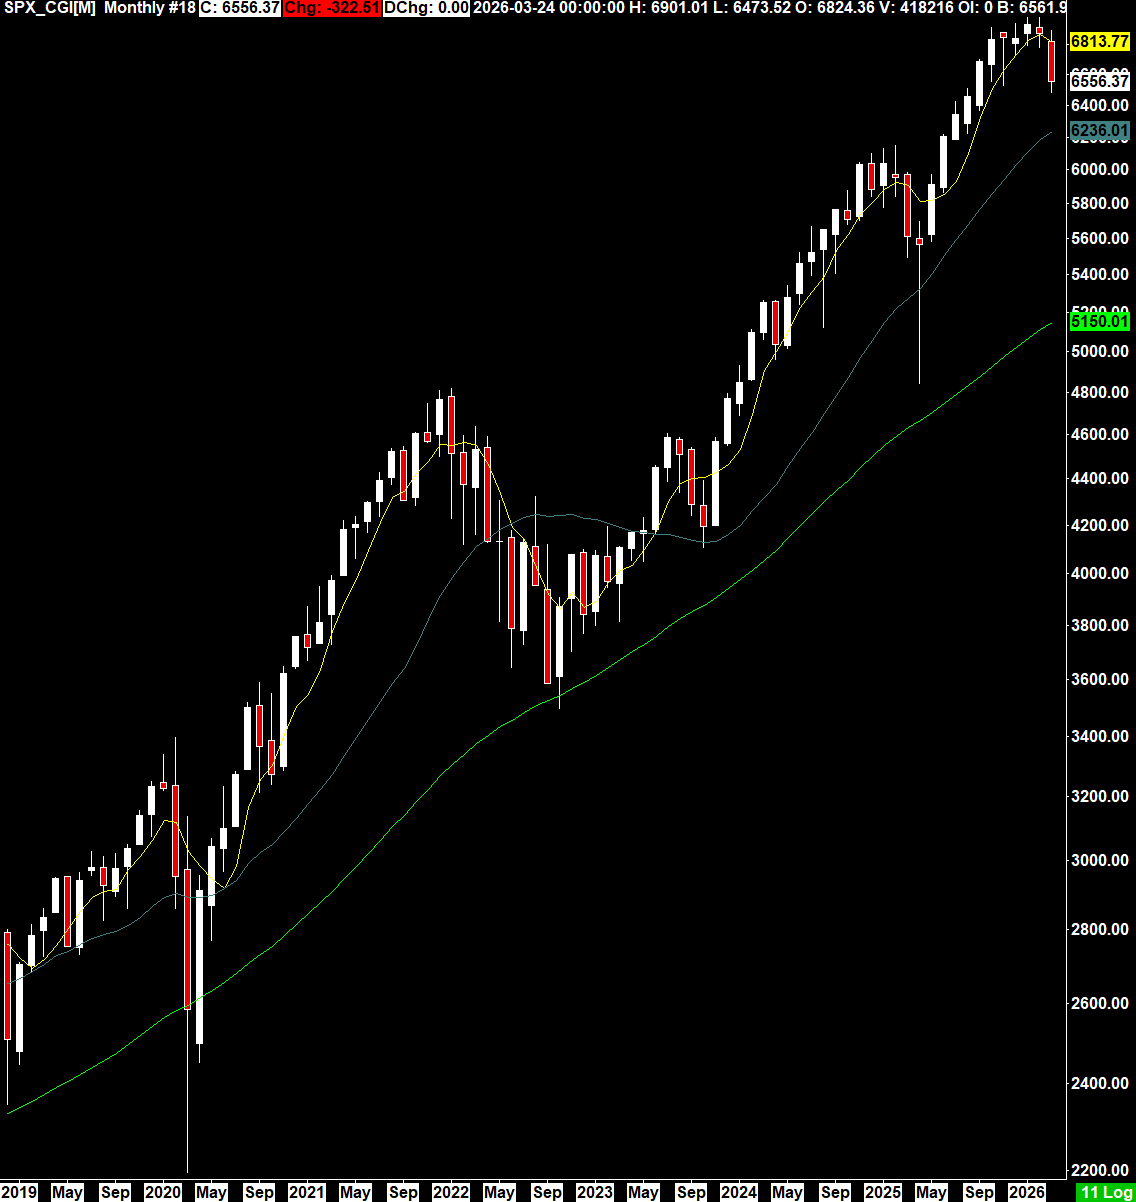
Monthly (log scale) - broken down after 3 month narrow balancing period. Holding below the 5 sma currently. Next major monthly support at the broken highs from Feb ‘25 (approximately 400 points lower)
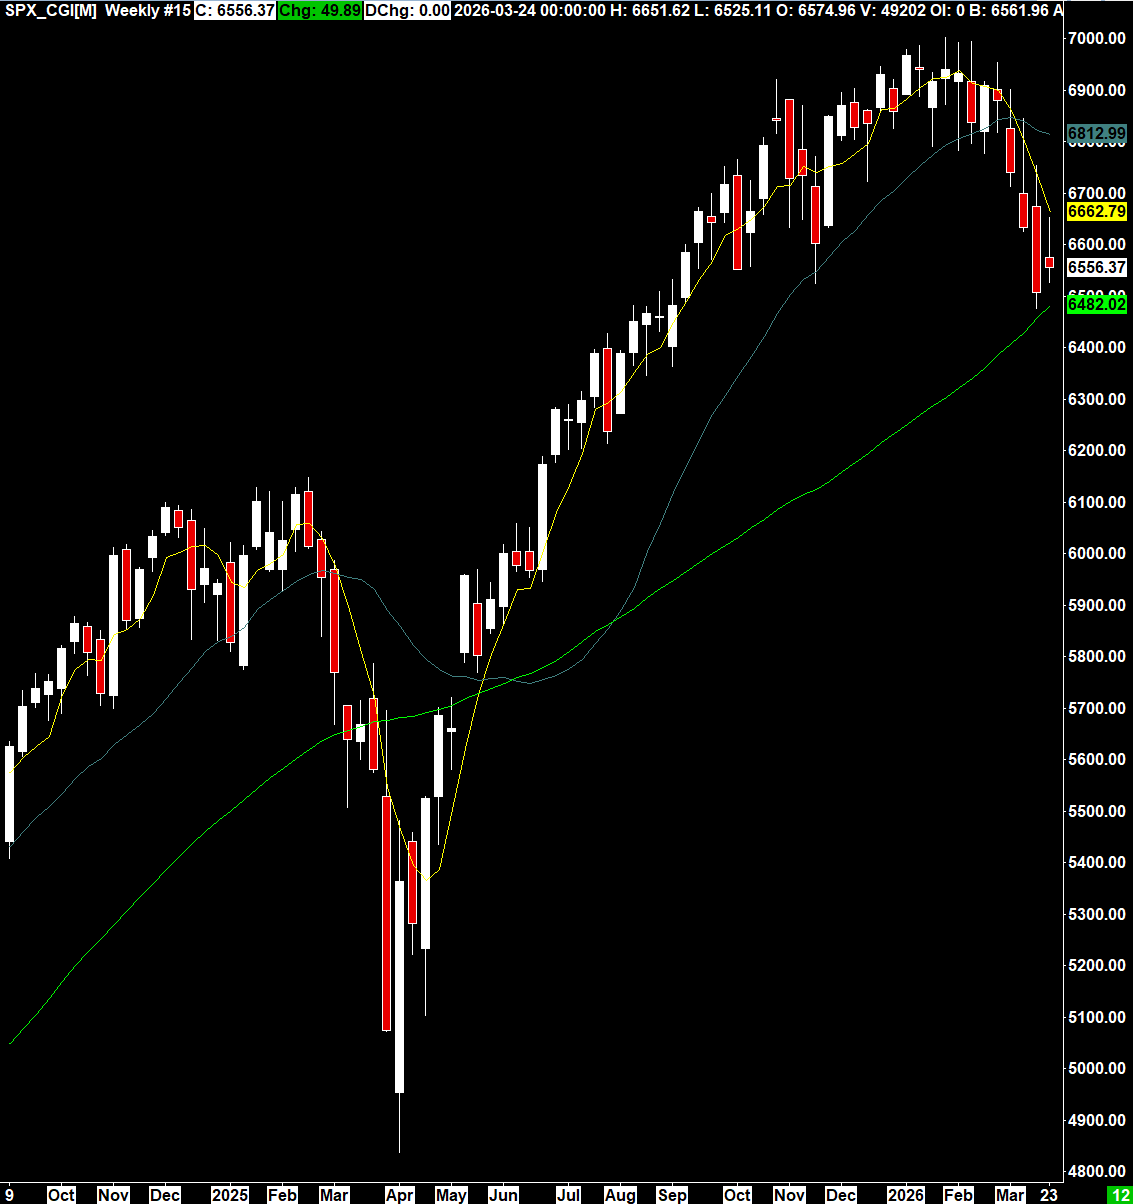
Weekly - one timeframing lower for 3 weeks leaving long selling tails as every rally is sold down. 5 and 20 sma tests have seen responsive selling. 50 sma around 70 points lower which is still in a strong uptrend.
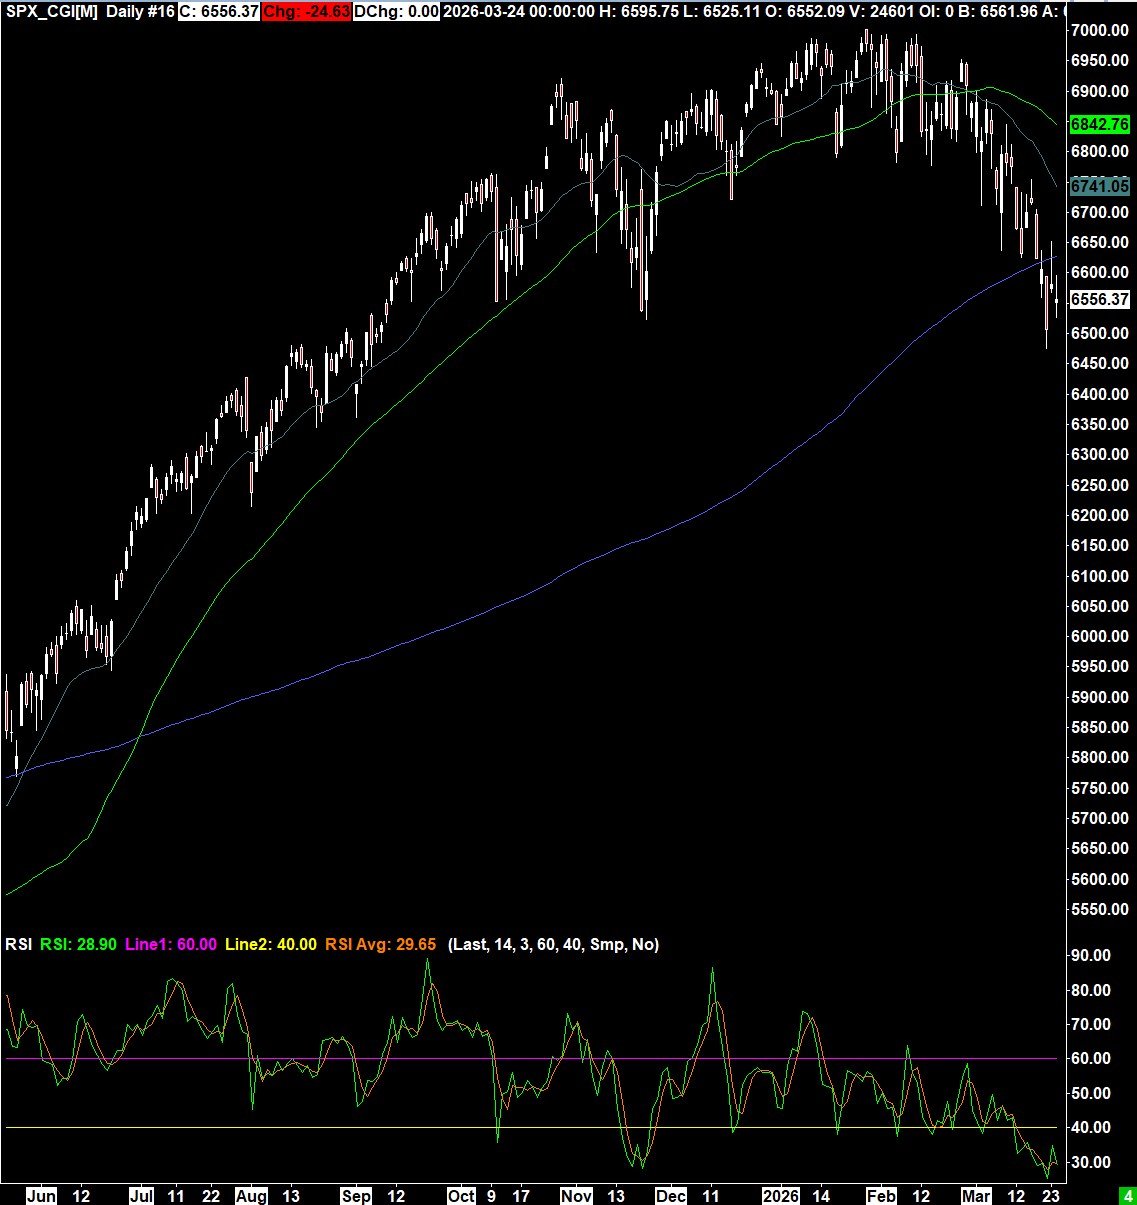
Daily - orderly decline with crossed and falling 20 and 50 sma, and sub 200 sma. RSI holding below 40 is indicative of the bull trend failing (currently 30). Support at 40 on RSI is indicative of a positive shift in momentum to bullish, and holding above 60 indicates strong bull trend.
Since the beginning of the war volatility has not surprisingly increased, but not to wild levels (Vix went from 20 to 34 and back to 20, and around 26 currently). Headlines dominate, as we saw on Monday when Trump tweeted and the market rallied 250 points in minutes following a steep downtrend which would have triggered short covering. Crude is essential to monitor simultaneously as the inverse correlation is strong currently with oil at all areas of production and delivery under attack.
Going into today’s open, the overnight session responded to hopes of a ceasefire settlement and is trading up about 50 pts from last night’s close. Yesterday’s RTH swing low area is my short term bull/bear as the market attempts a counter trend move. Breaking and holding beneath there leaves a lot of new longs offside and likely sets up a move for Monday’s low. On the upside there has been failure in the 6680 area overnight and a break would target 6700 and the big test is the spike high from Monday at 6748. Given the dominate short/intermediate trend is lower I’d look to fade key resistance zones for a reversal unless there is material positive news. However, there are good long opportunity zones on the intraday timeframe as well.
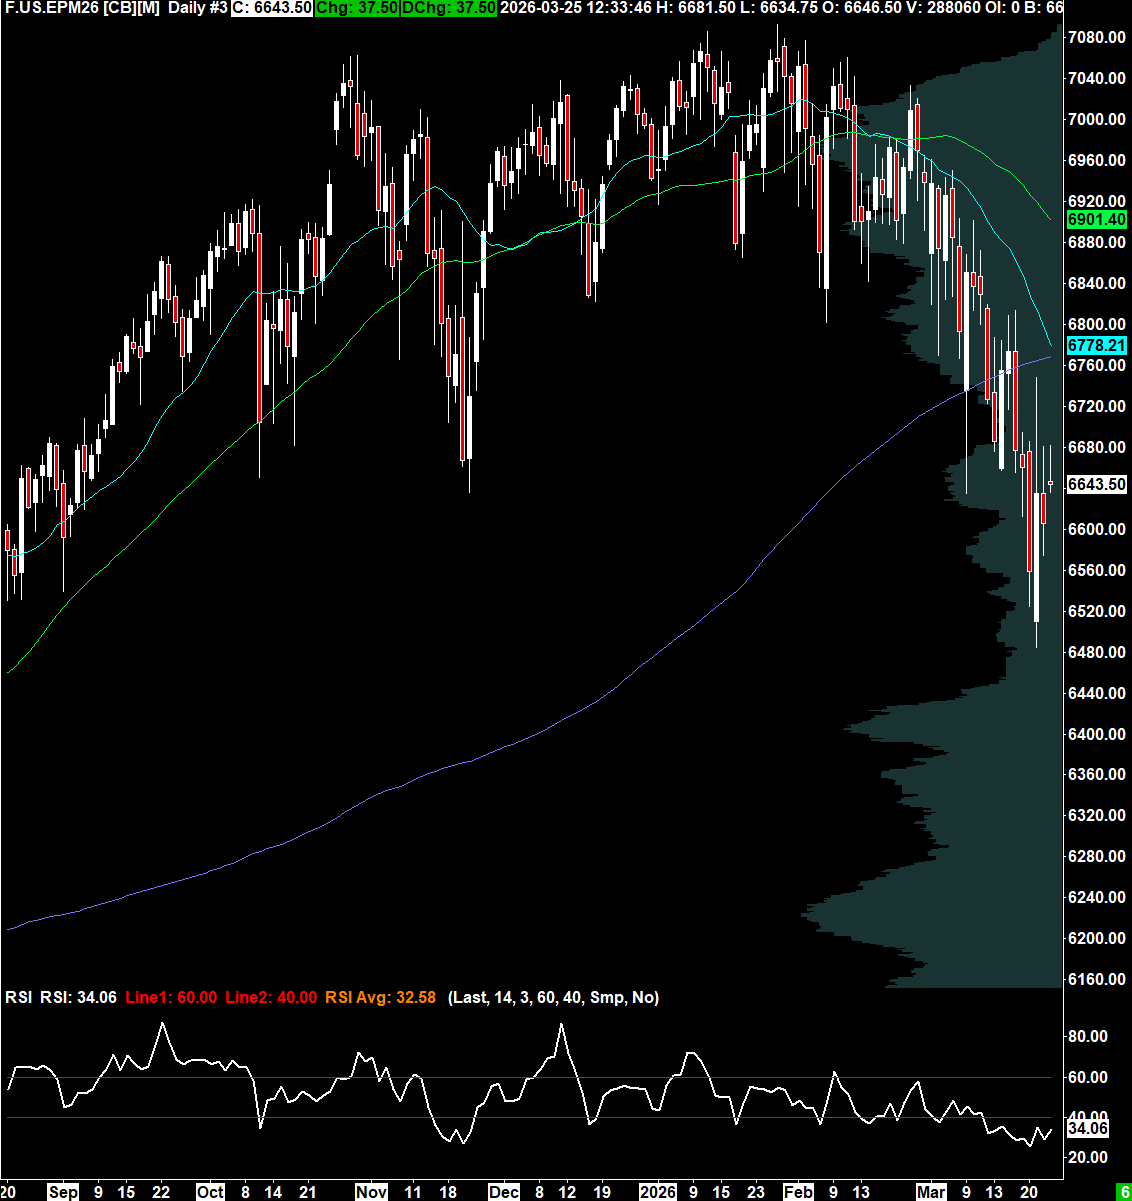
Overnight range is 6634.25-6681.75 versus yesterday’s settle at 6606.00
ES Morning Prep


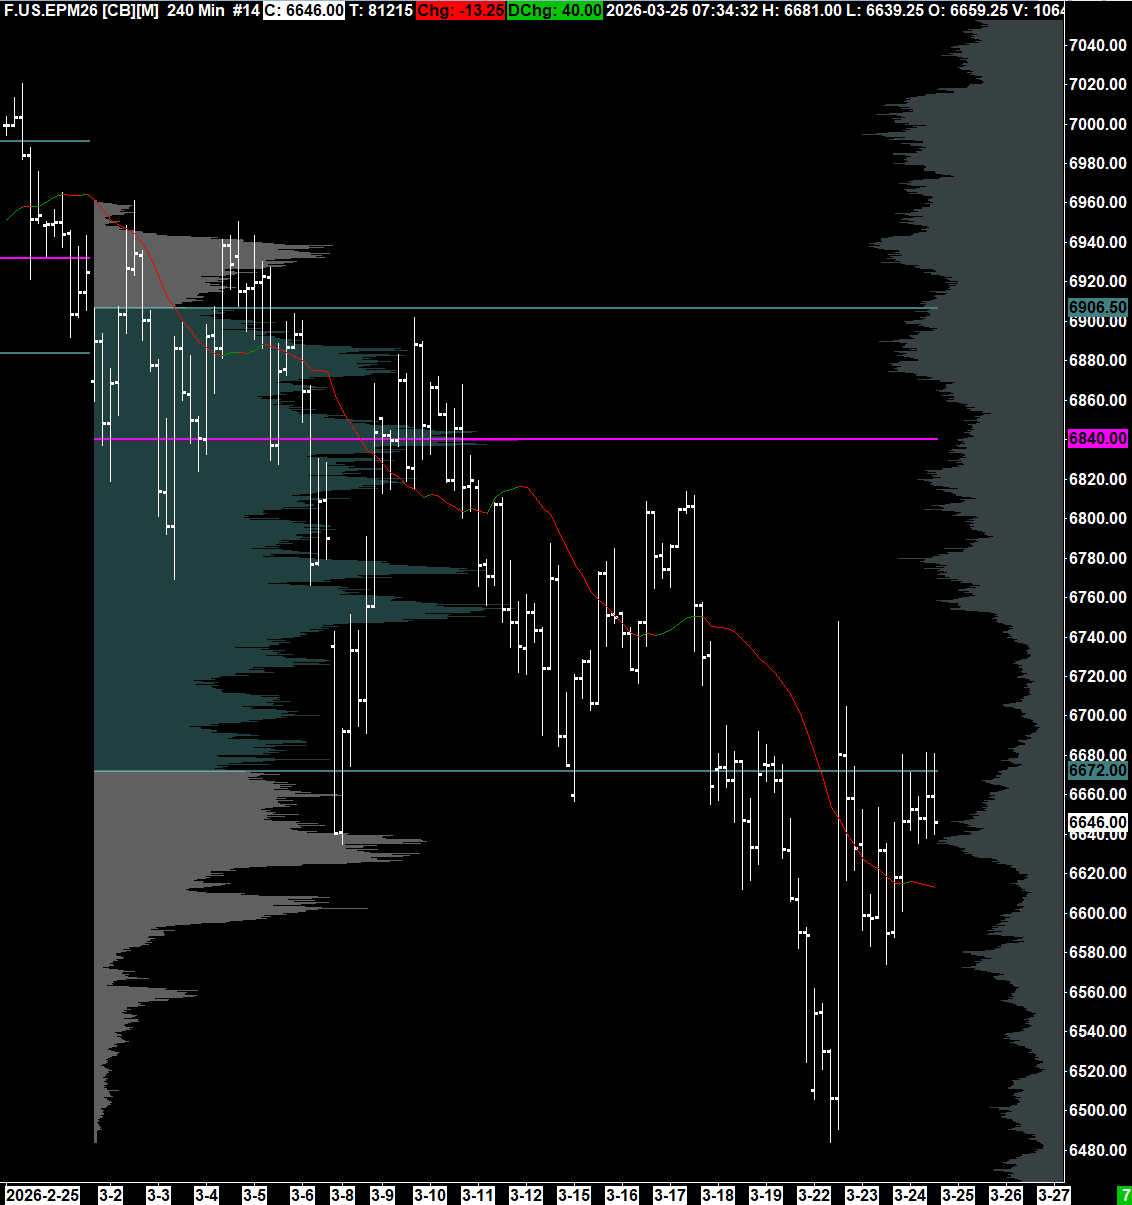
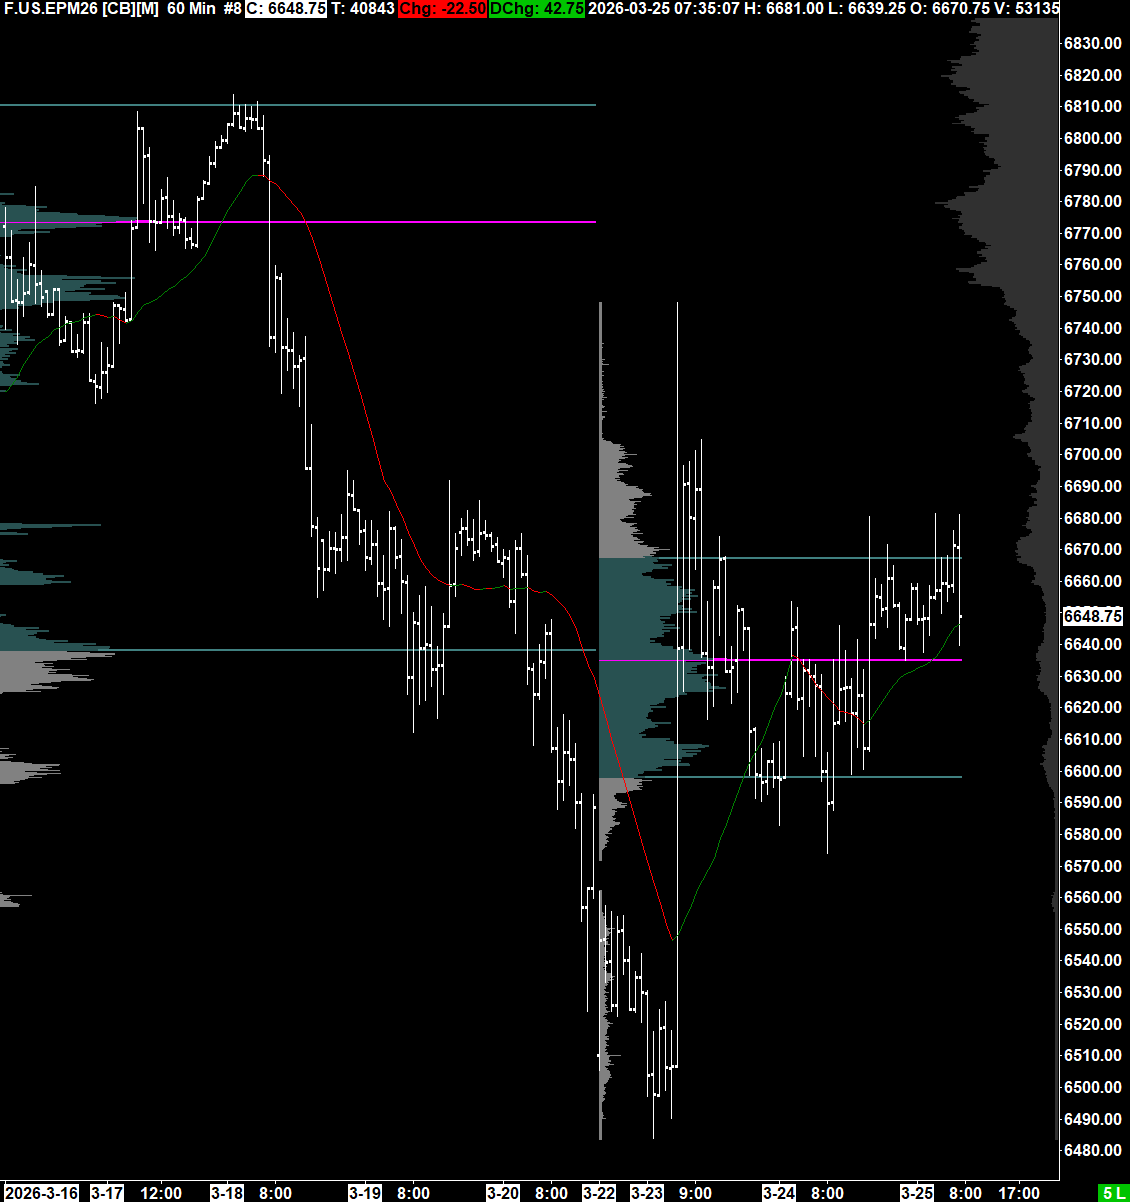
The charts above from left to right show a snapshot of long term to shorter term for ES:
Monthly - April range was 4830.00-5773.25 (943.25 point range!) So far in May we’ve failed to take out the prior high and are heading towards the April close of 5587. The April monthly candle left a 814 point lower ‘wick’, which is a huge outlier and I’d expect to see an attempt to retrace part of this - currently still holding above prior close and above the March low (5509.25)
Weekly - Prior week high 5724.75, low 5455.50 (5590 mid-point). Last week hit the 50 week sma and backed off after a strong thrust higher
Daily - Holding above the 50 day sma (though still trending down) and above the 20 day sma (turning up)
240 min - This chart also has the monthly volume profile with VPOC & value area high/low markers. So far holding above April value area, but pre-market is now holding under the value area low for May (5634 currently)
60 min - This chart has the weekly volume profile overlaid and so far the downtrend overnight is inside the prior week value area; the longer this remains the higher the chance of rotation lower to the other side of value.


Above left above the market & volume profiles for the overnight and cash sessions, above right is the cash session only.
The huge rally has not surprisingly paused and the overnight session has trended lower. In terms of expectations for today, the main scenarios i’m looking for are:
Open to take out overnight low and rally - looking to fade key reference points (vwap, VAH etc.) for continuation lower to test levels. If no rally above overnight low immediately then early push to auction lower prices - 5598-5600 key support zone - looking for more sellers if this fails. Looking for longs to hold if can push back above vwap and vah for today
April 15th Review & Plan


After a 5 year hiatus in publishing a daily note, it’s about time I restarted! We are in one of the greatest trading opportunity years in history, but to take full advantage of this we need to be fully prepared for the uncertainty we will face each day.
Top down Charts:
Monthly - one time framing lower (943.25 point range so far in April). March low 5509.25, April low 4830.00. Has retraced 50% of Feb high to April low.
Weekly - inside prior week 5528.75 high, found support at CLVN 5391
Daily - balancing inside prior day, range narrowed significantly with volatility dropping sharply
4hr - holding up upper end of value area, balancing
1hr - balancing above prior week value area high, contracting before next move. Prior week VPOC 5400
Thursday Prep
Review


We saw a lot of two sided trade yesterday leaving a range bound day above the upper half of the prior session. Post FOMC we saw liquidation and after hours the FB numbers drove futures further down, along with increased negative sentiment relating to coronavirus. Volume was significantly lower than we’ve seen in the past few sessions.
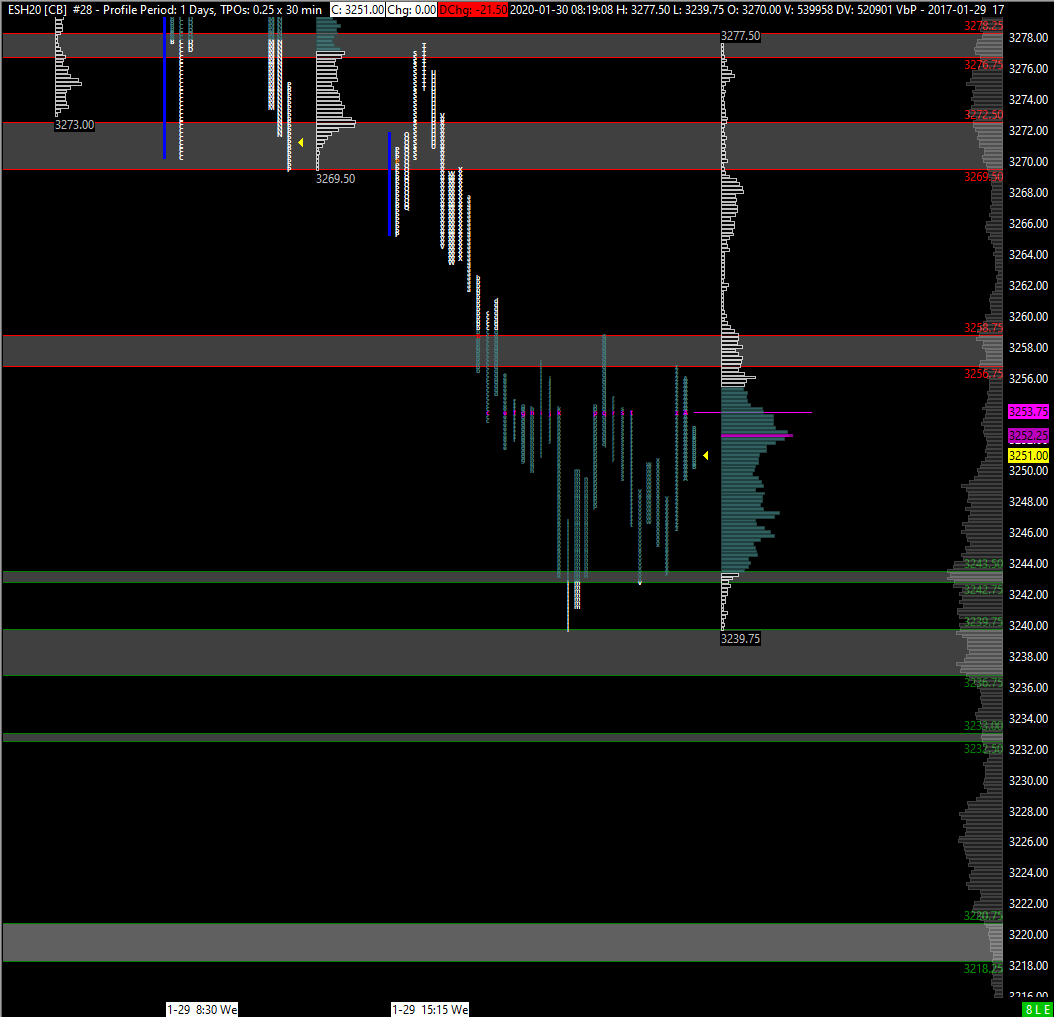
Overnight the range is wide, trading between 3277.50-3239.75, versus last nights settle at 3272.50
The market has developed a range within a larger range, as highlighted on the daily chart. Looking for responsive action within the smaller range, but on alert for a break from this balance area. Today’s zones of interest below on the split profiles

Wednesday Prep
Review


Yesterday’s opening action gave us a strong clue to at least refrain from the short side, because of the lack of momentum in the underlying stocks (using NYSE TICK). This created a great long opportunity for the gap close target. There we also good tradeable reactions off the red zone, with momentum weakening into that area (see above).
Overnight the range is currently 3273.00-3291.75, overlapping higher to yesterday’s range, helped by strong numbers from AAPL after hours.
The immediate overhead targets are the 3293.25-95.25 zone (Friday’s settlement and VPOC) and then the 3299-01.50 zone (composite low volume area).
Below are the 3276.75-78.25 (yesterday’s settle and VPOC) and 3272.25-73.25 zones (overnight low, prior LVN, prior afternoon swing low & initial balance high). If sellers break that zone there’s a strong chance of a flush lower into yesterday’s single prints etc to test the 3256.75-58.50 zone

Tuesday Prep
Review


Yesterday’s cash session opened inside the initial green zone on hugely negative NYSE TICK and flushed through the overnight low quickly but reversed just as quickly back through the opening price creating a short squeeze on an already extended downside overnight. As highlighted above, the initial red zone was a confluence of the London open swing low and breakdown point later in the morning. Volume was high at 2.7m contracts.
Today the overnight range so far is 3238.75-3263.75, still inside yesterday’s range. I’m looking to avoid trading in the middle of this range as could easily get chopped up, but instead wait for opportunities around the edges if it looks like a consolidation day, or look for pullbacks on trending moves.
This is my first week back trading ES after a long break, so I’m better off being patient and get into the flow of the market gradually. Trying not to let any opinions about the coronavirus outbreak is difficult but ideally be guided by what information the market is giving. My gut feeling is this could escalate into something major which in turn would push the over extended and heavily index positioned market over a cliff, and be a proper test of market liquidity. However, we could see some very aggressive rallies ahead of that so will try to let go of any news bias. FOMC tomorrow as well just to throw in the mix.
Zones of interest today are:
Monday Prep
Overnight sell off into the monthly VPOC
After last week’s data and platform fail, I’m hoping all issues are now resolved. It’s very rare I get any issues with either so was lucky not to have any positions on.
The risk off sentiment following the coronavirus outbreak has seen ES give back most of the month’s gains. Overnight action drove prices back to the Jan VPOC at 3237.50. There has been some short term support there, though ES is now trading back inside December’s range.
Friday’s settle was 3293.50 after dropping 32.50 points on volume of 2.4m. The overnight range is currently 3269.75-3235.75, gapping sharply below Friday’s low. The size of the gap makes it less likely to see that filled today (without a majorly positive news catalyst).
The two main scenarios I see that have potential for today to be ready for:
Attempt to rally through overnight range and into gap, squeezing weak shorts out before attracting new selling
Continued weakness after open, failing to break above overnight vwap and pushing down into the January VAL to find buyers
My green zones of interest for today are: 3218.25-3220.75 & 3235.50-3238.25 and red zones are 3257.00-3259 and 3268-3270. Above 3270 it’s into the gap and there may be a squeeze up to 80.50
Tuesday Prep
Not a great start to the first day back as my data feed is throwing my intraday charts out completely. However, using the regular trading hours profiles gives enough to eyeball the zones of interest for today.
The initial green zone represents the most recent volume & time consolidation ahead of a spike (from 16th). Will be looking at momentum and trade flow in this area for signs of absorption if looking for a bounce. If we see heavy selling through that zone will be looking for signs of responsive selling on a bounce back up to target the next zone below through the gap.